Live Chat
Need Help?
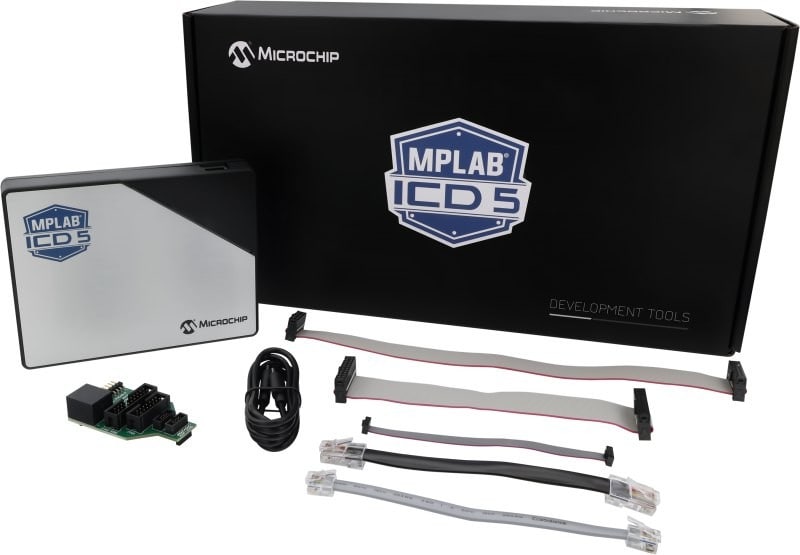
Privacy PolicyWe offer a range of programmers, emulators, debugger/programmers and extensions to support all device architectures. Stream your data to one of our free data visualizer tools, which are available as plug-ins for our Integrated Development Environments (IDEs), for real-time analysis of your application's run-time behavior.

Programmers and Debuggers
Explore our selection of programmers and debuggers to support your development using PIC®, AVR® and SAM microcontrollers (MCUs) and dsPIC® Digital Signal Controllers (DSCs).

MPLAB® Data Visualizer
Troubleshooting your code's run-time behavior has never been easier. Available as a plug-in for MPLAB® X IDE plug-in or a stand-alone tool, MPLAB Data Visualizer graphically displays run-time variables in an embedded application.

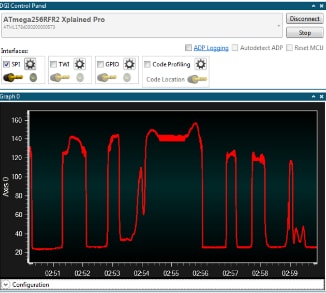
Atmel Data Visualizer
Available as a plug-in for Microchip Studio IDE, Atmel Data Visualizer captures and displays run-time power data from your application when used with the Power Debugger or a supported Xplained PRO board.